Using Analytics in Supporting Your Staff

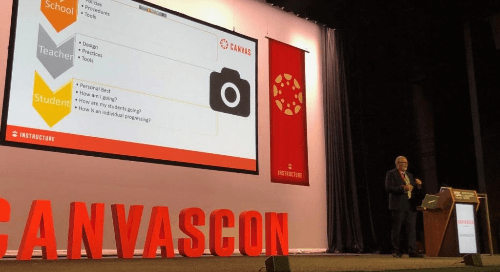
Data and Analytics was a hot topic at CanvasCon Sydney 2019. David Sheil and Jennifer Walsh took to the big stage to a full house to talk about how they are leveraging data provided by Canvas to support student learning and reduce administrative burdens that often get placed back on teachers.
Sheil is the Director of Teaching and Learning and Walsh is the Canvas Learning Coordinator at St. Dominics College in Penrith. Walsh is their Canvas Learning Coordinator. St. Doms, (as we affectionately refer to them) is in their 4th year of using Canvas.
Setting the scene, David Sheil talked about how they have positioned various Canvas components and integrations as the building blocks of their school’s teaching and learning programmes to set them up for success with data and analytics. First and foremost, they have made Canvas mandatory and all classes are in Canvas with centrally managed content from a Canvas Blueprint course. All notifications, tasks and most importantly, all results are captured and maintained in Canvas. They leverage a linked Office 365 environment to share docs and connect users as well as use Canvas as the communications hub of the college. This was critical in the early days of their Canvas implementation, making Canvas “the place where they live and where they learn.” Finally, as of 2019, all parents are enrolled in their students’ courses so that they have a fully transparent learning environment.
At St. Doms they are providing templates and tools to build a consistent learning experience. This provides clarity for the teacher around expectations and lifts the burden to set up and manage their classes and more importantly, it creates a more engaging student experience.
Everything that we’ve done at the college has been trying to shift the balance [by] reducing load in teacher administration and increasing the time that we spend on the teaching domain.
St. Dominics uses a number of tools to make data-driven instruction and administrative tasks for teachers an easy journey:
Built-in Canvas Tools
Whether it’s organising the course Syllabus so that parents can easily access course content from the Parent App or teachers reviewing course or student activity to seed conversations about how to support student growth and learning, Canvas is the hub.
Canvas Markbooks contain a wealth of information to support teachers in their own classes but St. Doms takes it to the next level by exporting markbook data for further analysis and cross-class data reviews. Faculty Coordinators are set up with proper permissions so that they only see the courses/teaching staff that they oversee. Sheil also recommends opening up the student view of the Canvas markbook when sitting with students to have conversations about their work. It’s important to get students to “move beyond the marks. We know it’s the feedback that improves learning.” In student view of the Canvas markbook, you can see teacher comments and feedback, individual task statistics (with a box and whisker chart comparing each student against the performance of the class), and rubric details and comments where they have been used.
St. Doms also uses Course Analytics and Course statistics. In the course analytics, class engagement and performance data is displayed. Individual student views are also just a click away in these dashboards.
Course statistics provides an insight for teacher, PLC and/or coordinator upon application of the course. Finally, St. Doms is using the new Canvas Analytics tools to get more information about student activity and performance.
Jennifer Walsh gave a live demonstration of these analytics tools and shared a story about being able to leverage this data to intervene in a student who was at risk for failing his HSC:
He was on about 16% for his overall marks with an ontime submission rate of about 40%. Further data showed that his engagement on individual learning tasks was well below the rate of the rest of the class (and this data was shown in the new Analytics tools in Canvas.) Thanks to the data that they were able to capture in Canvas (because Canvas is mandatory and all results are captured) He is now back on track and is going to get his HSC.”
St. Doms also talked about and shared images from their Executive Business Review that the Canvas Customer Success Managers shared with them (and can share with all Canvas customers) on a yearly basis to help evaluate their goals and progress to reaching key benchmarks in their Canvas adoption.
Canvas Partners
Before closing, Sheil shared a few bonus tools that they use to support students with Canvas Data. These tools are Canvas Partners and come at an additional cost, but they provided the framework and further visualisations that St. Doms was looking for to support their student’s needs.
Grade Guardian (formerly known as Dropout Detective)
Grade Guardian is a risk index-tracking tool that reports against classes, tutor groups, houses, sports teams and any other grouping framework that you need. The tool works from inside a single Canvas course, shows risk levels for learners across the system and shows teachers marks, performance and staff notes from across all of their courses. In this way, teaching staff can support students and their needs on a case by case basis.
St. Doms is working with Octopus BI to build longitudinal data dashboards that pull Canvas Data and make it easy to compare performance year on year.
Rounding out the presentation was additional focus on the Executive Business Review that Canvas provides all of its customers. Just as data can be used to bridge the gap between what we think we know and what is really happening in the classroom, the usage statistics and success metrics in the Canvas EBR can help an institution understand what is really happening in their learning environment. Leveraging this data allows every Canvas customer to adjust goals and reflect on internal practices and understand if their learning goals are really being met.
This blog was inspired by the contents of the following Canvascon Sydney Session:
Using Analytics in supporting your staff - from Compliance to Differentiated Professional Learning
David Sheil, Director of Teaching and Learning Infrastructure
Jennifer Walsh, Canvas Learning Coordinator
St. Dominics College, Penrith
Keep learning,
Jared Ward
Manager, Solutions Engineering and Bid Management, APAC
Related Content
 new_and_next_apac_june_2025.png
Blogs
 meet-canvas-apac-team-christopher.png
Blogs
 philippines_ched_cmo.png
Blogs