LMS as the Learning Analytics Hub: Early Alert Systems in Higher Ed

Penn State generates close to two terabytes of raw learning activity data every day across 89,000 students and 24 campuses, and until recently, almost none of it reached instructors while a course was still running. "Our faculty is hungry for data to support students," said Ben Hellar, manager of data empowered learning, explaining why the university built Course Insights to surface engagement signals during the term rather than after it. The pilot launched in Fall 2021 and now runs in more than 4,000 courses for over 250 instructors.
Every institution running an LMS sits on data like that, but they’re not all able to turn their data into actionable insights that support student progress and improve retention.
Helping students decide to stay
The National Student Clearinghouse Research Center tracked the nearly 2.62 million students who started college in fall 2024. A year later, 77.1% were still enrolled somewhere, but only 69.1% were still enrolled at the institution where they started. Most of the students an institution loses at that rate are leaving while still academically eligible to stay, having decided somewhere in the first year that the place wasn't working for them.
There are lots of reasons that students point to for leaving a higher ed program, from academics to cost of attendance to work to other responsibilities outside of academia. Regardless of the reason, the signals that students might leave are there before they make the decision, and early alert systems can help institutions find ways to keep them enrolled and on track.
Early alerts should live in the LMS, not beside it
Tyton Partners surveyed more than 3,000 students, advisors, faculty, and administrators across 825-plus US institutions for Driving Toward a Degree 2025 and found two things.
First, the demand side: "Less than half of students are aware of academic advising, and only 29% report using it." Second, the supply side: staffing shortages are pushing more than 70% of large and public institutions to increase advisor caseloads, and nearly 40% of four-year publics anticipate budget cuts to student support services over the next three years.
So the traditional channel for catching struggling students reaches fewer than a third of them, and might be getting thinner. But the LMS is also the primary hub of information, not just a content delivery system. It’s a communication tool across all parts of campus, connecting and exchanging data across systems like the SIS, assessment tools, publisher content, proctoring and accessibility services, analytics platforms, and the credentialing, which is why early alert systems need to function inside of and as an extension of the LMS.
Predictive analytics that work across higher education
Early alert systems and learning analytics tools need to work for everyone at the institution, and at all the intersections of instruction and administration.
- The adjunct in week two. She teaches one section of 34 students. On Thursday she notices a student with no submissions and no page views since the second day of class. She has no advising relationship with him, and no idea whether anyone else has noticed.
- The advisor with a Monday flag list. His caseload is 340 students. The dashboard shows 61 flags this week. Nothing tells him which three matter most, and by Wednesday afternoon he’s only worked through 12.
- The administrator with a Friday deadline. The provost office wants a retention dashboard. Course activity lives in the LMS, credit history lives in the student information system, financial holds live somewhere else. He can build the dashboard by Friday. Getting four offices to agree on which system is authoritative might take a whole semester.
- The provost reading a year-end summary. The report says the institution generated 4,200 alerts last year, up 18%, but it’s harder to say how many produced a conversation, or whether flagged students did better than comparable students who weren't flagged.
Most teams in higher education need learning analytics data for different things, but the right tool can surface the right information, help the right people across functions get in sync, and make it clear what needs to come next.
The capabilities that make early alerts work
Vendors describe this category in wildly different language, which makes comparison hard. Here are the capabilities that determine whether an early alert program actually functions, and what each one contributes.
Capability | Who works in it | How it contributes |
|---|---|---|
Course-level engagement view | Instructors | Shows who has gone quiet while the course is still running, so the person closest to the student can act earlier |
Participation measured as specific actions | Instructors and administrators | Separates students who are present from who are just logging in |
Assignment status reporting | Instructors and advisors | Turns missing and late work into a working list, the earliest reliable predictor in most courses |
Messaging from inside the analytics view | Instructors and advisors | Closes the gap between noticing and reaching out |
Institution-level dashboards | Administrators and leadership | Aggregates the same signals across courses and terms, so patterns surface at the program level and not just the section level |
Institution-defined risk criteria | Administrators | Puts the rules in your hands and makes them explainable to faculty governance and adjustable mid-semester |
Plain-language querying | Advisors, deans, and leadership | Lets the people doing outreach ask their own questions instead of queuing behind a data team |
Raw data export with a documented schema | Data and IT teams | Supports institutions building their own models, and keeps the analysis portable if systems change |
Adoption measurement | Administrators | Shows whether anyone acted on the flag to help distinguish a working program from a busy one |
Data freshness measured in hours | Everyone | Determines whether the dashboard supports intervention or just records history |
Three questions can get you started on early alert functionality conversations with vendors:
- Which specific student actions count as participation, and can you see the full list?
- Do instructors get the course-level view by default, or does it take an administrator request?
- Can you inspect and change the risk criteria yourself, mid-semester, without filing a ticket?
What the LMS can see, and how early: An analytics approach across 3 states
A study published in Big Data and Cognitive Computing on November 20, 2025 worked with 22,437 students and built a model that predicts at-risk status using only data observable within the first two weeks of a course, then tuned it to a flag rate instructors could handle. At their recommended threshold, the model "flags 15% of students with 84% precision and 35% recall, creating actionable alert lists instructors can manage within normal teaching duties."
What drove the predictions are metrics that every institution can use: “assessment completion and activity patterns dominate demographic factors, providing transparent evidence that behavioral engagement matters more than student background”. Basically, what a student does in week two tells you a lot.
San Diego University
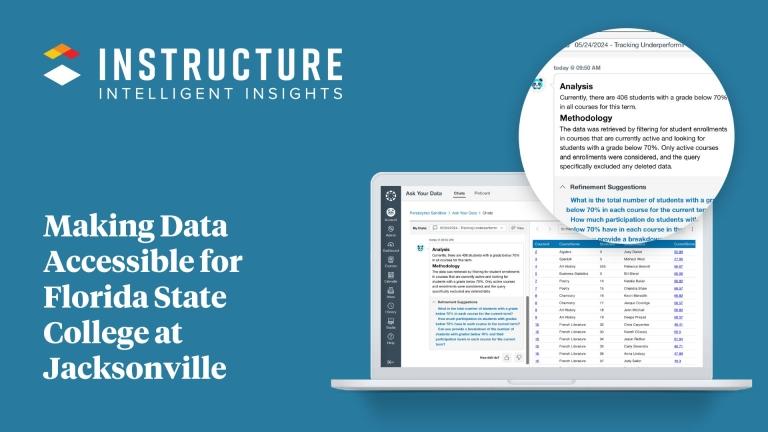
Sean Hauze, senior director of instructional technology at San Diego State University, describes what plain-language querying changed for a campus of more than 37,000 students: it opened up tools "democratizing access to the data, not just for the technical team members that know how to write SQL and other technical languages for looking at data, but actually just asking in natural language: Which students are at risk?" His example of the follow-through was simple: ask the data which students haven't logged in for two weeks, then share that list with advisors.
Penn State
For most schools, the data is available, but it lives in different places. To be truly useful, most faculty know they need the data where they already work, not another tool, and so the most effective early alert systems can pull all the relevant information into one place. That's the path Penn State took, pulling LMS data alongside Kaltura, Top Hat, Starfish, and the student information system into Course Insights.
Indiana University
Sometimes the first step is to start with the calendar, not the software. Writing for the Association for Institutional Research in February 2026, a team from Indiana University and Indiana University Indianapolis described what their own data told them about timing. Engagement roster notifications submitted by the end of week three turned out to be, in their words, "highly predictive of end-of-semester grades." Campus policy had required faculty reports by week six. The provost reset the expectation for all lower-level courses to the start of week four so that actionable insights were available earlier. The whole intervention was a revision to the reporting calendar, costing nothing.
That's the cheapest test available to almost any institution, and it's a good way to start small with your own data. Pick one lower-level course sequence. Pull engagement and grade data from the first four weeks of the last three terms, and check whether it predicts final grades on your campus. If it does, you'll know exactly which signals your early alert criteria should use.
Explore data and analytics for higher education to see how ready-made reports and customizable data tools help you understand course and student performance, progress, and engagement trends and plan for what’s next.